Jira
6 min read

Understanding the cycle time of Epics in Jira
Mon Mar 27 2017
Agile teams strive to continuously improve every aspect of their operation. Agile organisations do the same. And to effectively improve an organisation we must understand current performance so we can identify opportunities for improvement.
In this article we explore how an organisation can improve planning and collaboration across teams by understanding the cycle time of epics in Jira Software.
Cycle time?
Cycle time is the time an item of work spends ‘in progress’. Lead time is the amount of time an item of work spends awaiting work and in progress (i.e. from when a customer raises a request / when the work item goes on the backlog until it is done).
Jira Software includes a control chart which enables you to drill into issue data in Jira and identify cycle time. And understanding cycle time can be really helpful for improving the performance of an agile organisation.
We will focus on cycle time in this investigation, although there are situations where lead time can be equally important.
Why epics?
Teams often use the Epic issue type in JIRA to denote an experiment or project. Or there may be several epics across several teams which together comprise a program of work.
Understanding the time taken to complete an epic can help an organisation improve dependency management, collaboration between teams, and project success.
Some questions that we wanted to answer at Twitter in 2013 included:
- how long does the average epic spend ‘in progress’?
- is there a pattern from team to team, or group to group?
- is there a correlation between project success and cycle time?
- can we improve dependency management with this information?
- does understanding cycle time help us better set expectations?
For more context around the approach we used atTwitter see Collaborating Across an Enterprise: Quarterly Planning at Twitter.
Scaling Organisational Agility
Being an agile organisation at a team of 1 is easy, at 10 teams it becomes more difficult, and at 300+ teams — like we had at Twitter — it can be quite a challenge.
We believed understanding epic cycle time would allow us to improve flow across the organisation, and improve collaboration between teams.
To successfully conduct this investigation we needed to standardise all 300+ teams on the same workflow so we could gather data and generate standardised reports. We found it was easier to get a baseline and understand when we’re talking the same language (at scale).
As such we moved all software development teams on to The Twitter Way — Epics workflow. And we had a parallel The Twitter Way — Development workflow for stories, bugs and tasks.
Incidentally, there was also ‘The Twitter Way — Simple’ which was a workflow used by agile teams outside of the Product & Engineering organisation (procurement, legal, HR, etc).
The Twitter Way — Epics
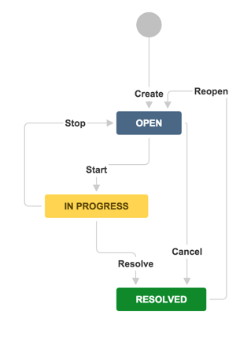
This is a simplified example of The Twitter Way — Epics workflow. Epics would be created, moved to In Progress when work began, and they would then move to Resolved once complete.
At Twitter we also had two optional steps — Accepted and Shippable. Accepted showed that a team had put the epic in their backlog of work to deliver and Shippable showed that the epic was in a holding pattern, perhaps waiting for experiment results or an Apple App Store submission.
As every team chunks their work differently we can not compare one teams epic to another teams. This is just like comparing story point estimates from team to team — it does not make sense. However at a certain scale we had sufficient information that the way a team chunked their work did not matter — we had enough data to discern patterns across groups (collections of ~20–80 agile teams with a product focus).
Unfortunately Jira Software decouples the status of an epic from the actual workflow using a custom field called “Epic Status” (Jira Status vs Epic Status). This meant we could not check cycle time for epics on a kanban board as the epic was never moved to the In Progress or Resolved state.
Sync Epic Status to Workflow
To get the data we needed we decided to sync the Epic Status field from Jira Software to the actual workflow steps which we can build a control chart report from.
Add Post Function to Transition

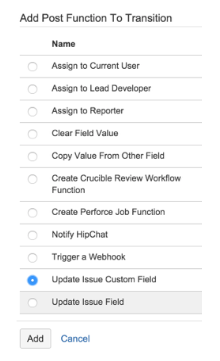
We took the Epic Workflow, as above, and added transitions between each step with a post function that updated the Epic Status field. This post function is the Update Issue Custom Field post function from JIRA Suite Utilities.
Add Parameters to Function

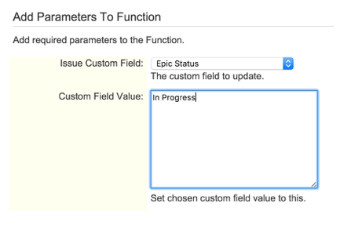
For instance, the “Start” transition was present when an issue was in the Open status. When this transition occurred the Epic Status field was set to “In Progress” and the issue was placed into the In Progress status.
Post Function Published

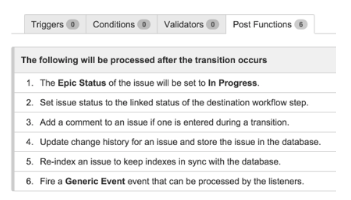
Epic Status set to In Progress, keeping it aligned with JIRA Status
This is the final result, a post function that is executed every time an epic is transitioned from Open to In Progress. Similar post functions were present for each transition ensuring that our cycle time reports had the correct data.
Voila! We now had a transition and a post function for each step of the work ow which kept the Epic Status in sync with the Jira Status and The Twitter Way — Epics workflow.
This allowed us to understand the cycle time of our epics.
Control Chart
The Control Chart is the tool of choice for exploring cycle time of epics over time. Find it via the Reports tab in Jira Software. Here is an example control chart showing an average cycle time of 1.7 days:

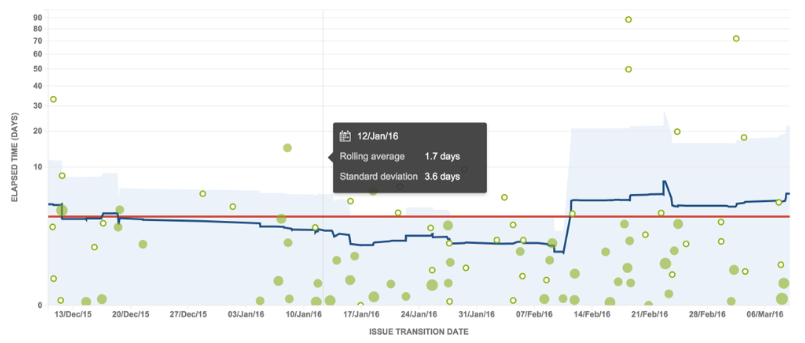
For more on interpreting control charts see Viewing the Control Chart.
Epic Cycle Time
We created a Kanban board in Jira Software that pulled in every project (one project for every team, so over 300 projects) and the epics for those projects.
category = engineering and type = epic
The Project Category in Jira was used to capture those groups which comprised ~20–80 teams.
We could then see all epics from all projects in the Product & Engineering organisation on a single control chart. With Quick Filters we could cut by group, experiment, etc. It was a very powerful tool for helping us understand our organisational throughput and WIP limits.
Outcomes
Ultimately this information gave us great insight and informed our experiments on how to improve the effectiveness of the engineering organisation. Having this information made it trivial to see whether our experiments at improvement actually had the outcome we had hoped for.
Do you track cycle time in your agile organisation? What have you discovered?