Agile workflow
7 min read
An Intro to Affinity Mapping: Grouping Data and Finding Solutions
Thu Jul 01 2021
Brainstorming as a group can generate a ton of ideas, but what do you do with all of those ideas after you’ve come up with them? How do you organize an entire team’s ideas? How do you narrow down the best solution? And how do you document the ideation session so you don’t lose any data? Never fear — affinity mapping is here. 🗺
Affinity mapping is an agile technique that helps teams reach a consensus after a brainstorming session, usability testing, or user research survey. It’s most helpful when you have a large amount of data to sort and when you need to distill all of that data into specific solutions the whole team agrees on.
Continue reading to learn more about affinity mapping, including when to use the maps, the benefits of affinity maps, and how to run an affinity mapping session.
What is affinity mapping?
Affinity mapping is an agile technique used to solve problems by distilling many ideas into the best solution or path forward. The exercise is designed to quickly get teams on the same page about a problem that needs to be solved.
Typically, affinity mapping occurs after a large group brainstorming exercise during which many team members and sometimes clients or stakeholders have given their input.
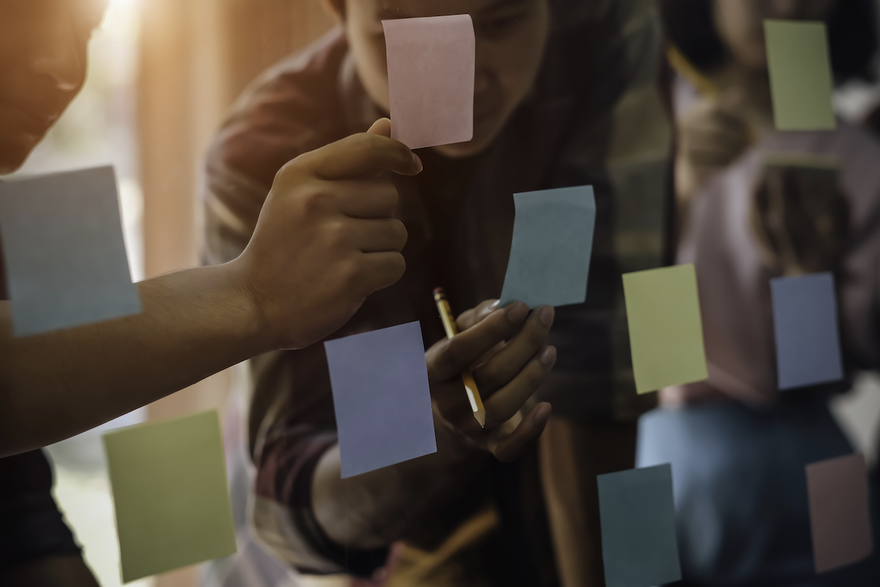
All of the team's ideas are added to sticky notes, which are organized somewhere for everyone to see. The team groups similar solutions until natural relationships form. Everyone involved in the session is able to see various paths forward, which can be discussed and narrowed down to the best solution.
Try affinity mapping whenever:
- A problem needs to be solved as a group
- The team has struggled to reach a consensus
- There’s an issue or problem that’s too complex or tough to grasp
- You need to reach one solution that everyone on the team will buy into
- Large amounts of data need to be sorted
- Data or survey results need to be analyzed
- A project or product is in a state of chaos
The activity sparks initial discussion on problems that are best solved by many minds coming together and agreeing on a course of action. Affinity diagramming is typically used in user experience design, UX research, and design thinking industries, but the practice can be implemented by any team that wants to distill information.
The benefits of affinity mapping
Affinity mapping provides a number of benefits for teams that need to solve a problem, sort large amounts of data, or reach a mutual consensus.
Affinity mapping helps teams:
- Prioritize what’s most important
- Unlock ideas that hadn’t been considered before
- Discover the “real” problem
- Work together to solve a problem (team building)
- Empathize with users or customers on common pain points
- Utilize multiple minds
- Reach a consensus together
- Make decisions without using up too much of anyone’s time
- Establish a safe environment to flesh out touchy or conflict-fueled discussions
- Facilitate equal participation, even from those who speak up less
- Involve stakeholders and clients in the discussion and agile process
The step-by-step process for affinity mapping

You can use affinity diagrams for a variety of reasons. They are commonly used to sort a large number of ideas after a brainstorming session or to make sense of data after usability testing, user interviews, or other user research.
Brainstorm ideas or collect data
The first step (or preemptive step) to affinity mapping is collecting your data points. If you are trying to solve a problem or make sense of a project, this will involve running a brainstorming session as a group. Make sure everyone starts solo when brainstorming to ensure no one is influenced by other people’s ideas before they’ve come up with their own.
It can help to frame whatever problem you are trying to solve into a “how might we” statement. For example, “how might we get younger audiences to use our product” or “how might we double last year’s sales goals.”
If you’re working with research findings for your session, you instead need to transcribe all of the qualitative data so that it can be organized and sorted during the mapping session.
Post the ideas or data for everyone to see
Take all of the ideas everyone came up with and put them on individual index cards, or use a separate sticky to represent each point on a whiteboard or wall. It’s important the surface you choose is visible to everyone.
Begin grouping data
As you add each point to the main wall, sort them into related groups. Organize the clusters naturally, combining or separating clusters as branching ideas form.
Don’t discard any duplicate thoughts, as these will help you visualize how popular an idea is. Continue to add to the board until every sticky note or card has a reasonable place on the visible wall.
Use a “parking lot” for ideas you can't sort
Create an area along the side of your wall called a “parking lot” for any ideas that don’t fit into a cluster. As you continue to build and sort the board of ideas, you may find reasonable spots for them.
Assess and name each category
Assess your clusters. Are there any clusters too similar to one another that could be joined together to create a larger group? Are there any clusters with too many branching ideas that should be separated into smaller groups?
Once you’ve completed your sorting and thematic analysis, it’s time to name each category. Don’t take too much time on this part. The category name just needs to generally describe the ideas inside the cluster. If you need to, vote on the best name to ensure too much time isn’t spent debating.
Vote and make decisions
If you’re analyzing a collection of data, you can now document the findings. What categories have the most data points? What connections do you see between clusters? What observations can you make from common themes?
Before dismantling the map, ensure you document everything with photographs so you can go back to the affinity map at any time to gather more insights.
If you’ve arranged ideas from a brainstorming session, it’s time to discuss the possible solutions and vote on the best option. Placing each solution category on an impact effort matrix helps the team visualize where their effort would be best spent. You can also work through different forms of voting, such as dot voting or the hundred dollar test.
Affinity mapping for remote teams
Many of the teams and businesses we work with are remote, which means getting into one room to collaborate around a bunch of Post-its isn’t an option. Luckily, there are plenty of online tools that make affinity mapping possible for remote teams.
You can create an affinity diagram template and follow nearly all of the same steps for affinity mapping by using online collaborative design thinking tools like Mural.
Affinity mapping brings teams together for a collaborative experience. It’s a simple process that ends with a consensus around the best solution or path forward. It’s especially helpful for complex problems, bottlenecks, or times when the team needs to get on the same page.
More From Easy Agile
Easy Agile is passionate about helping teams work better. To us, that means working more efficiently, effectively, and collaboratively. If you want more agile articles and how-to guides like this one, follow the Easy Agile blog for our latest content.
We build products specifically designed for Jira users to help agile teams collaborate using buyer personas, roadmaps, user story maps, and more. Our tools are simple to use and integrate directly with Jira for seamless product development. Try any of our plugins free for 30 days.